View internal statistics related to the Best HTTP/2 plugin, integrated into the Unity Profiler window.
Installation
Steps to install and setup:
- The profiler addon has a dependency on the com.unity.profiling.core that requires Unity 2020.1 or newer installations.
-
Make sure that the Best HTTP/2 package is already installed.
-
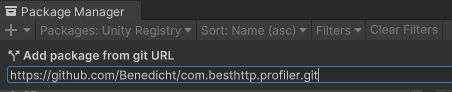
Using the Package Manager window install the package from the following git source: https://github.com/Benedicht/com.besthttp.profiler.git:
-
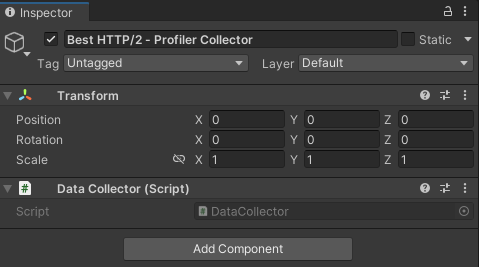
Create a new GameObject in your scene and add the DataCollector component:
Network Profiler
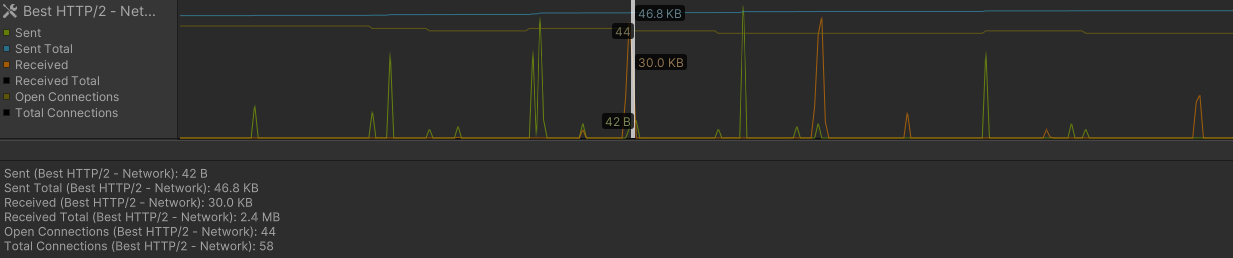
Collected fields:
- Sent: Sent bytes since the previous frame.
- Sent Total: Total bytes sent by the plugin.
- Received: Received bytes since the previous frame.
- Received Total: Total bytes received.
- Open Connections: Currently open connections. An open connection might be an idle connection that have no active request/response to process.
- Total Connections: Total connections, including open ones too.
Open Connections and Total Connections, negotiation request and response doesn’t registered in Sent/Sent Total/Received/Received Total.Memory Profiler
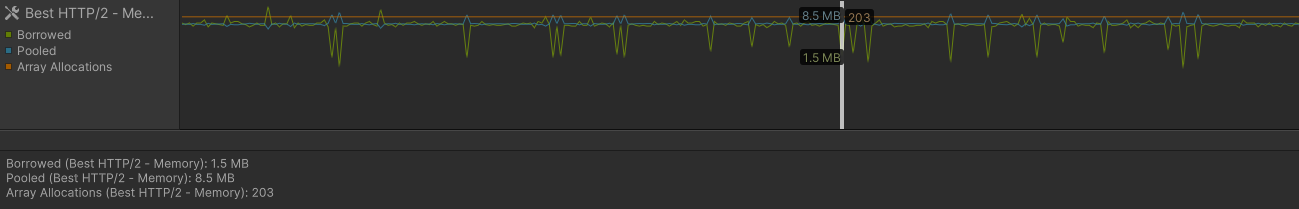
Collected fields:
- Borrowed: Borrowed memory from the BufferPool.
- Pooled: Memory in the BufferPool available to borrow.
- Array Allocations: Total number of
byte[]allocations through the BufferPool. An allocation occurs when there’s no suitablebyte[]in the pool to borrow. If it’s constantly growing, increasing BufferPool.MaxPoolSize might be a good idea.
Data Collection
There are two ways to collect data for the profiler. The first one is to use the DataCollector component attached to a GameObject.
The seconds method is to use the ProfilerUpdater directly from code. ProfilerUpdater.Attach() can be used to start collecting, its best place is somewhere in a startup code before any other plugin releated calls. ProfilerUpdater.Detach() can be used to stop data collection.